Products
Our Watch Leads (OWL)
Is a one-stop-shop for clients who want to acquire a real estate property or plan a construction, providing valuable information for Site Selection and producing the Project Design required to license and build.
In terms of Site Selection OWL uses Satellite Earth Observation, combined with AI, GIS and GNSS data, informing clients where the best neighbourhoods to invest in and the best land properties to build on are located.
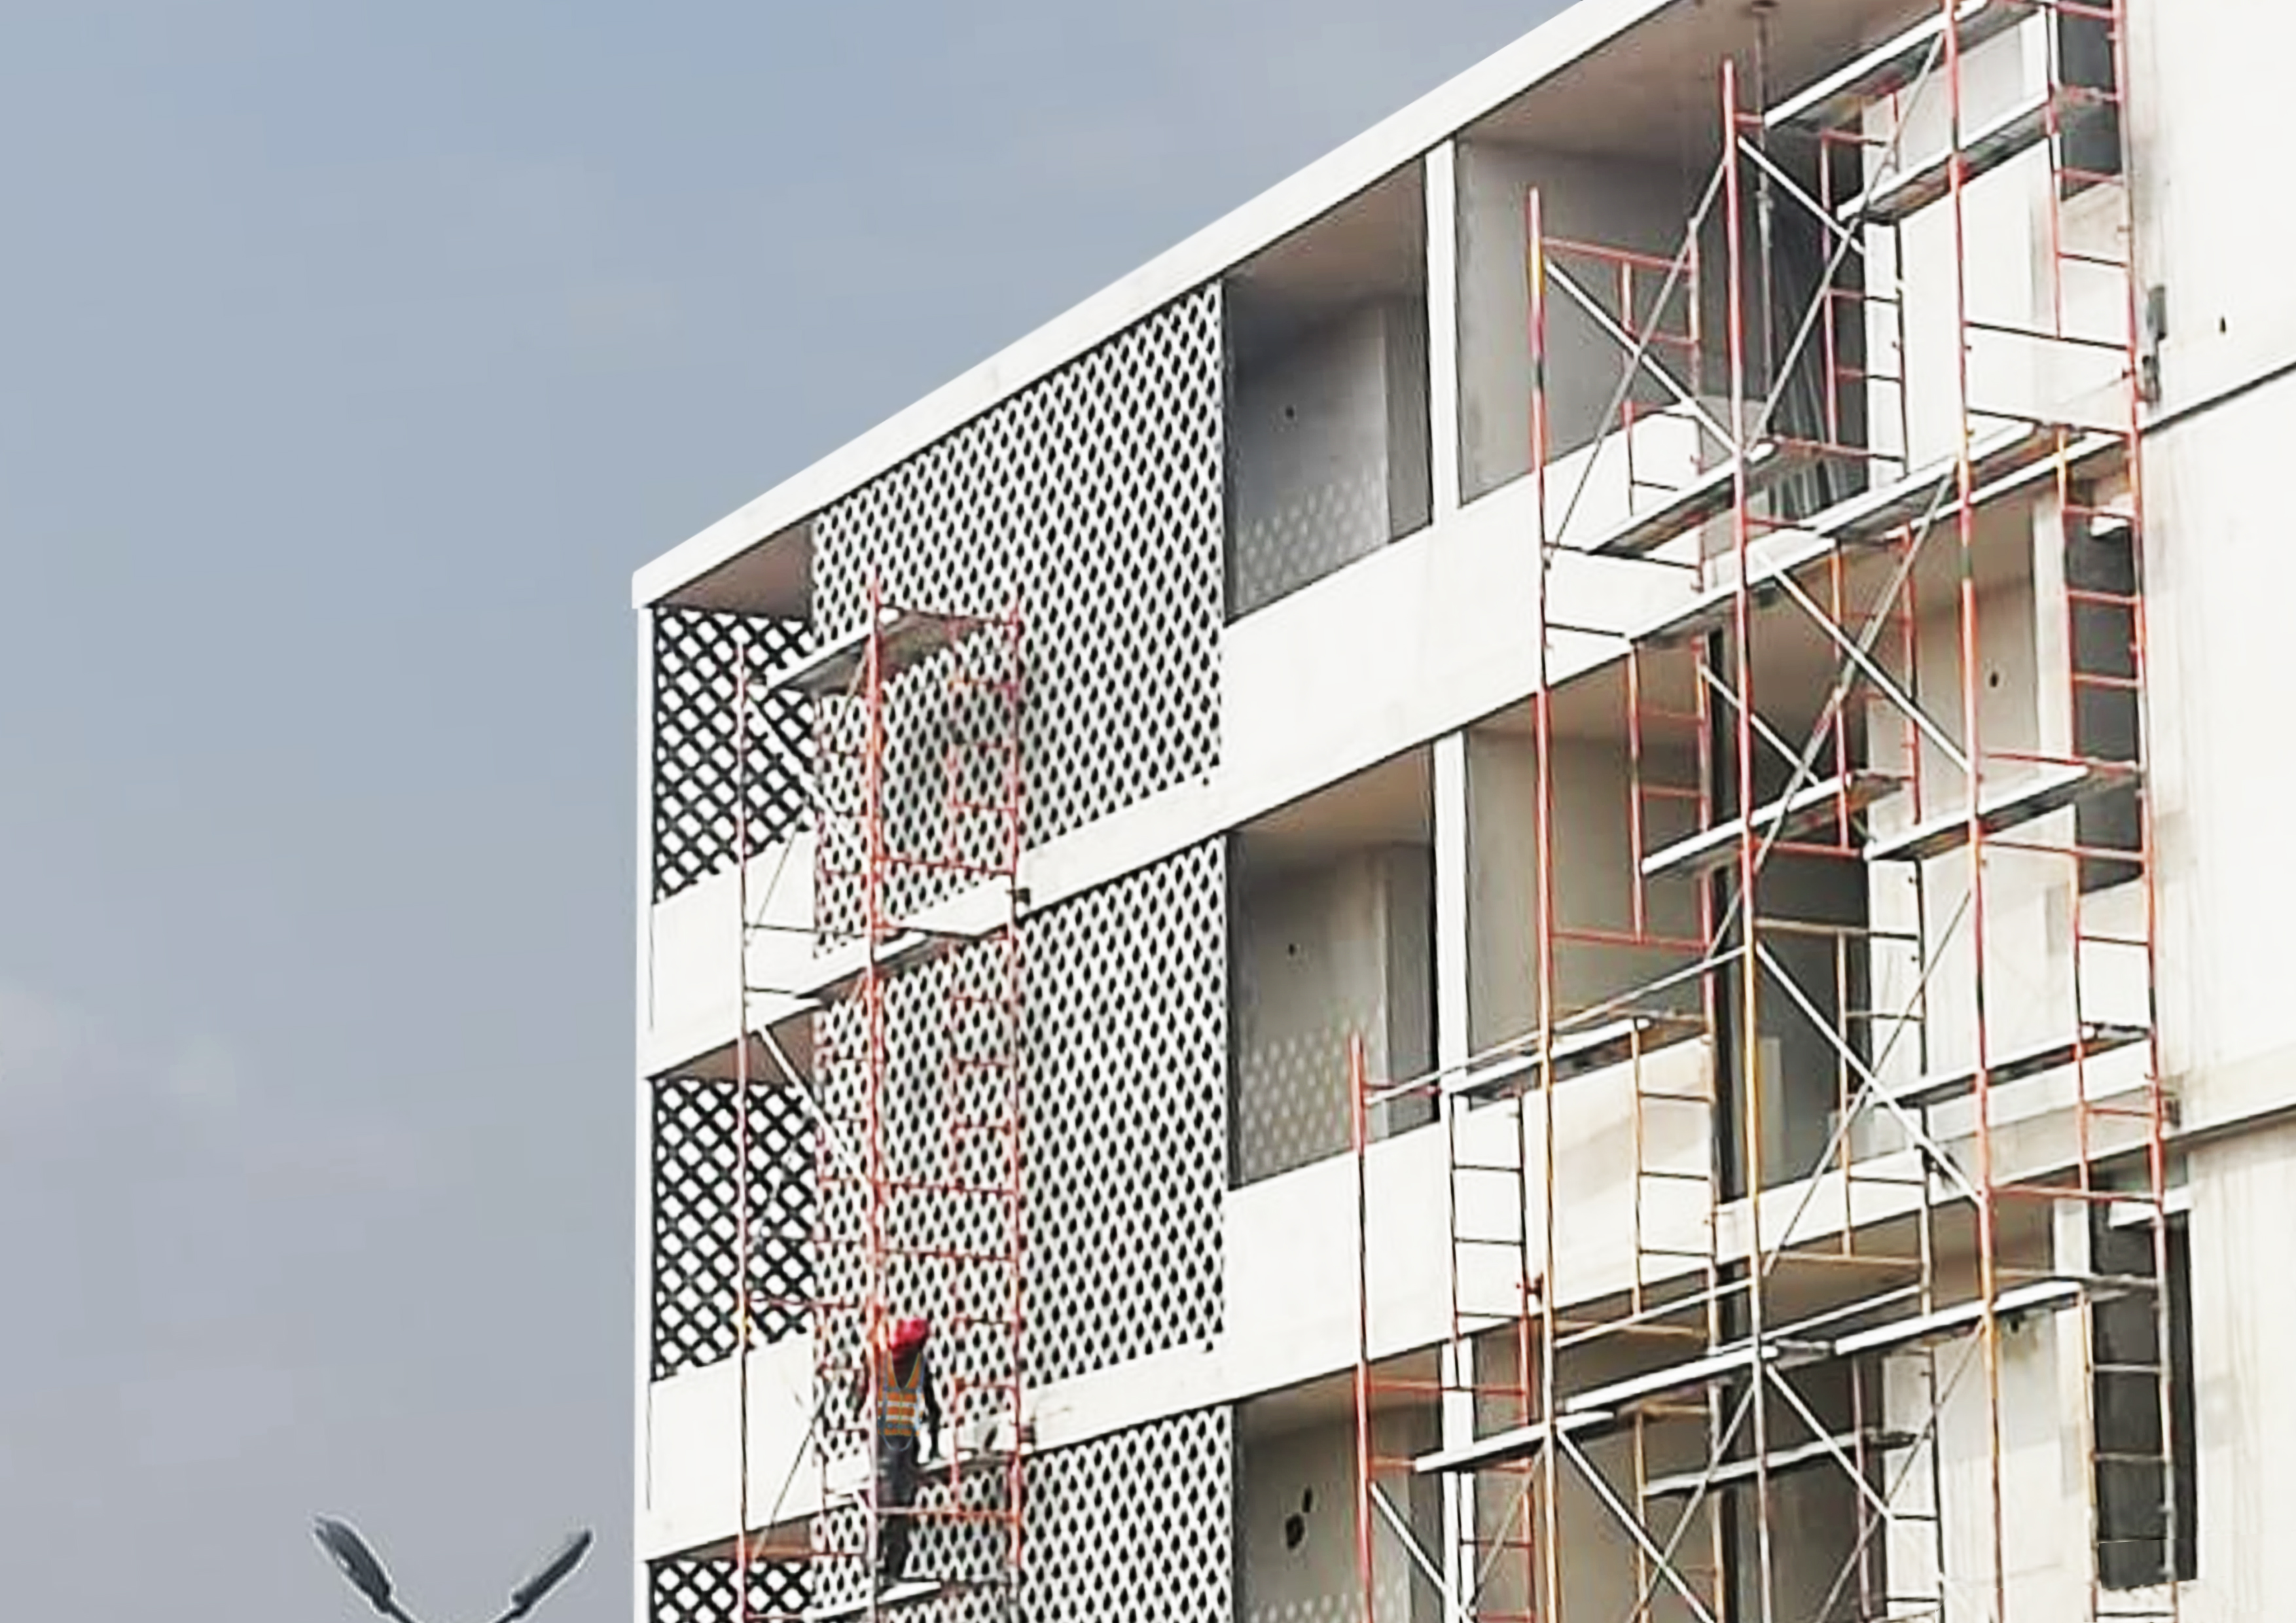
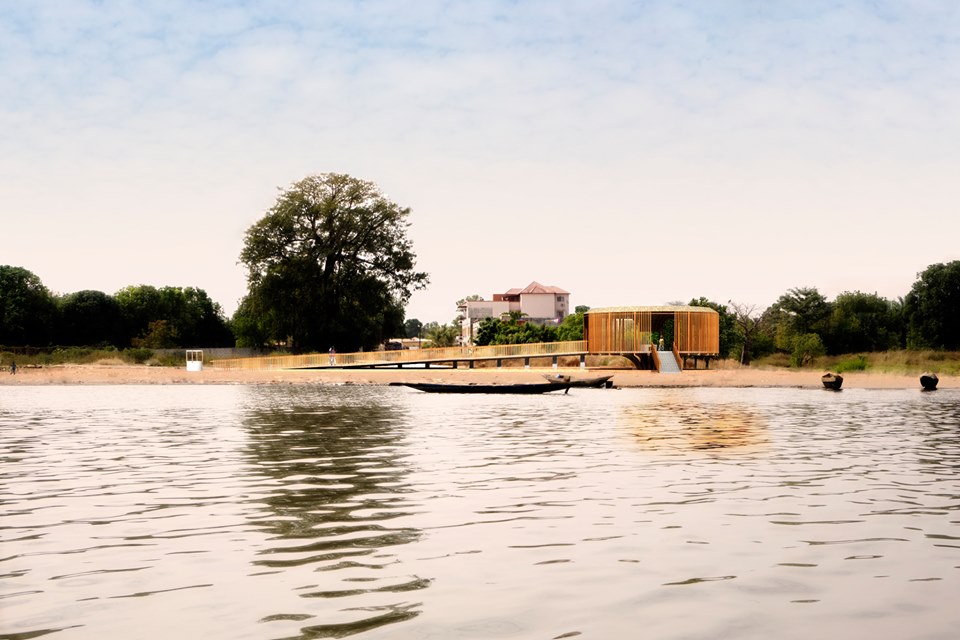
In terms of Project Design, the company uses state-of-the-art BIM methodology, combining 3D with material quantification and 2D details. The team has produced several designs for Portugal and Angola, for various types of construction, from prefabricated structures for large-scale industrial and commercial facilities, to high-rise residential buildings built with concrete structure and masonry work.
Project Design
The Architecture project combines the in-situ visits & measurements, with available GIS and Earth Observation data to diagnose the Intervention Site.
This diagnosis then informs the Architecture and Engineering Project team that will produce and deliver all written and drawing documents necessary to license and build a construction.
The drawing documents are delivered in non-editable PDF, as well as in editable 2D CAD (DWG and DWF), Geotiffs (QGIS), 3D Building Information Model (Revit BIM) formats, and Word and Excel files for the written documents.
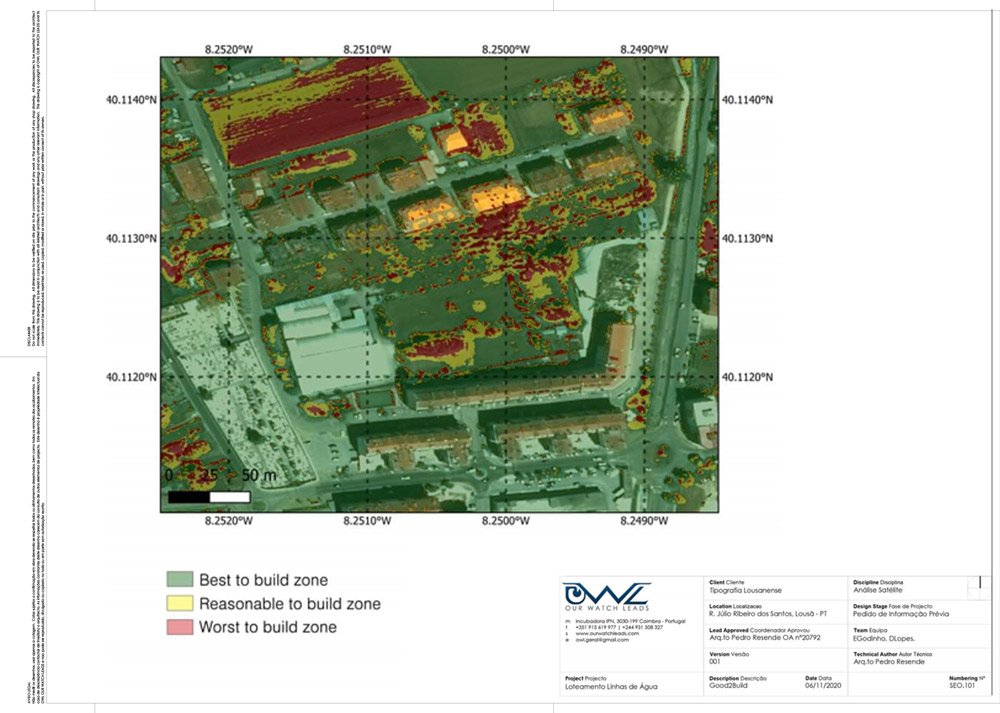
“Good2Build” - Site Selection
The "Good2Build" is a certification product that rates a land property in terms of viability for construction. This product assesses the topography, vegetation and water in the soil from any land property around the world. Parameters that allow to estimate the implementation cost of constructions. By purchasing this product users can make an informed site selection in the land property acquisition stage, decreasing expenditures in the construction’s foundations, containment walls, imperviousness, rain water drainage, while, at the same time protecting the richer areas in terms of biodiversity.
This product can also be used to assess a single land property, distinguishing the best and worst areas to locate a building or infrastructure.
Delivered in PDF. Can be upgraded to BIM format and Geotiff (GIS Format).
Price: from €200.00 + VAT/Certification
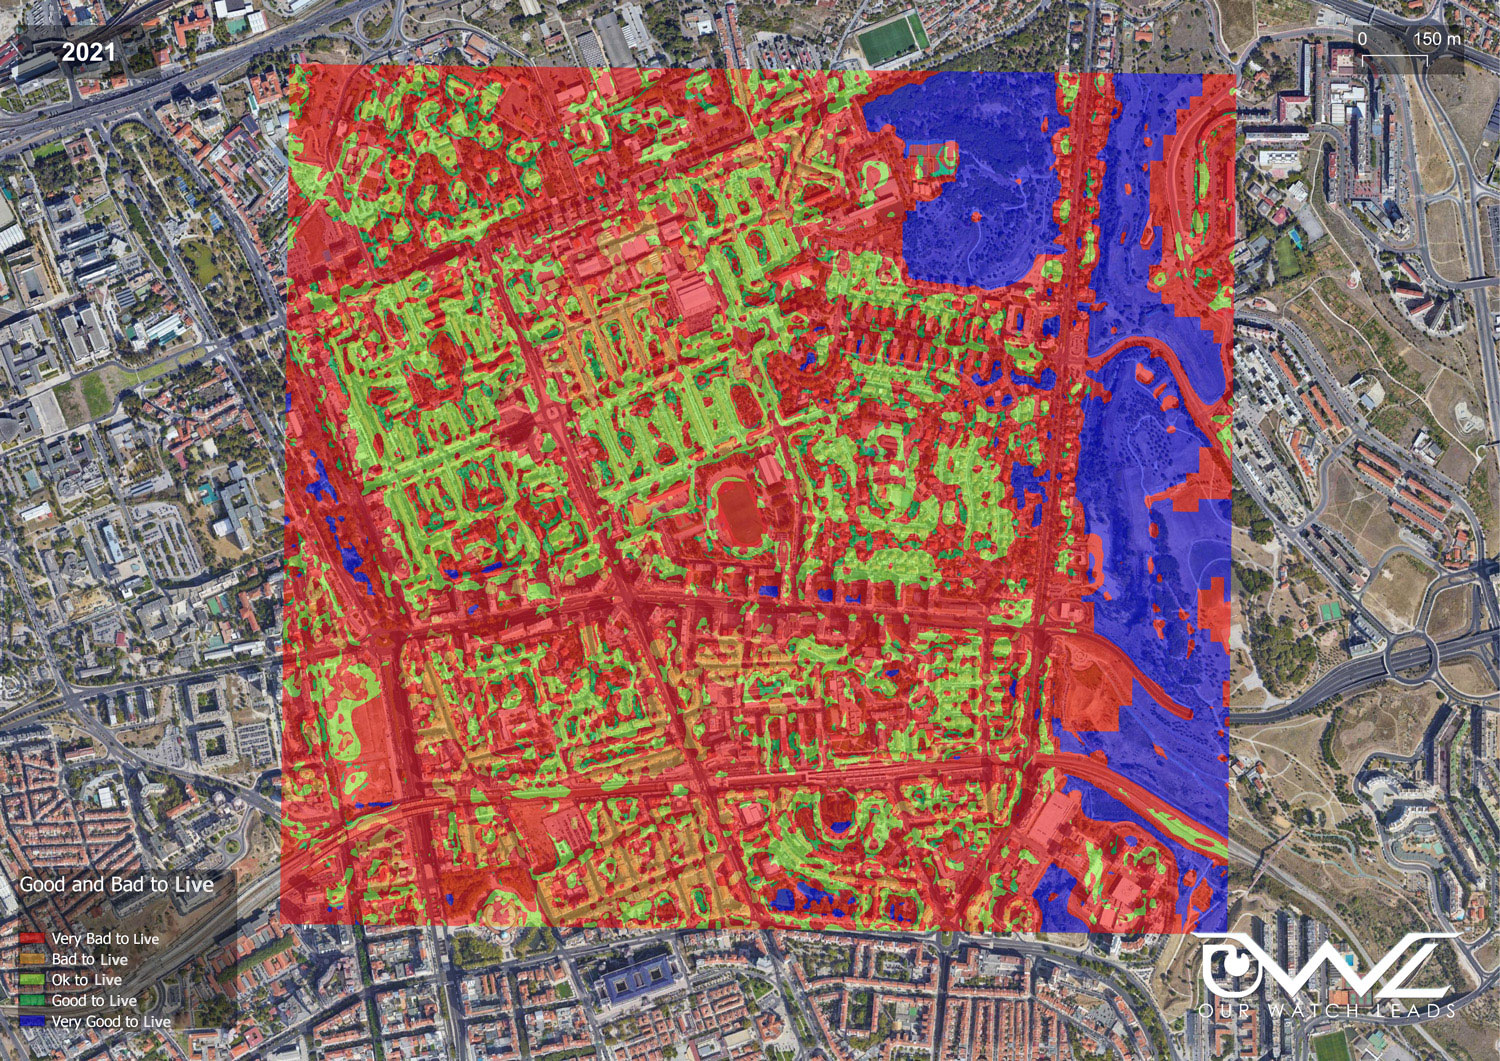
"Good2Live" - Life Quality index
The "Good2Live" is a certification product that rates the life quality around a real estate property. This product assesses the vegetation, water in the soil and thermal comfort surrounding any apartment or single family house around the world. Parameters that allow to add value to the sell price of the property, as well as allowing the buyers to understand the healthier neighbourhoods to live in.
This product can be applied in house hunting, to assess the value of a real estate property according to its surroundings.
Delivered in PDF. Can be upgraded to BIM format and Geotiff (GIS Format).
Price: from €200.00 + VAT/Certification
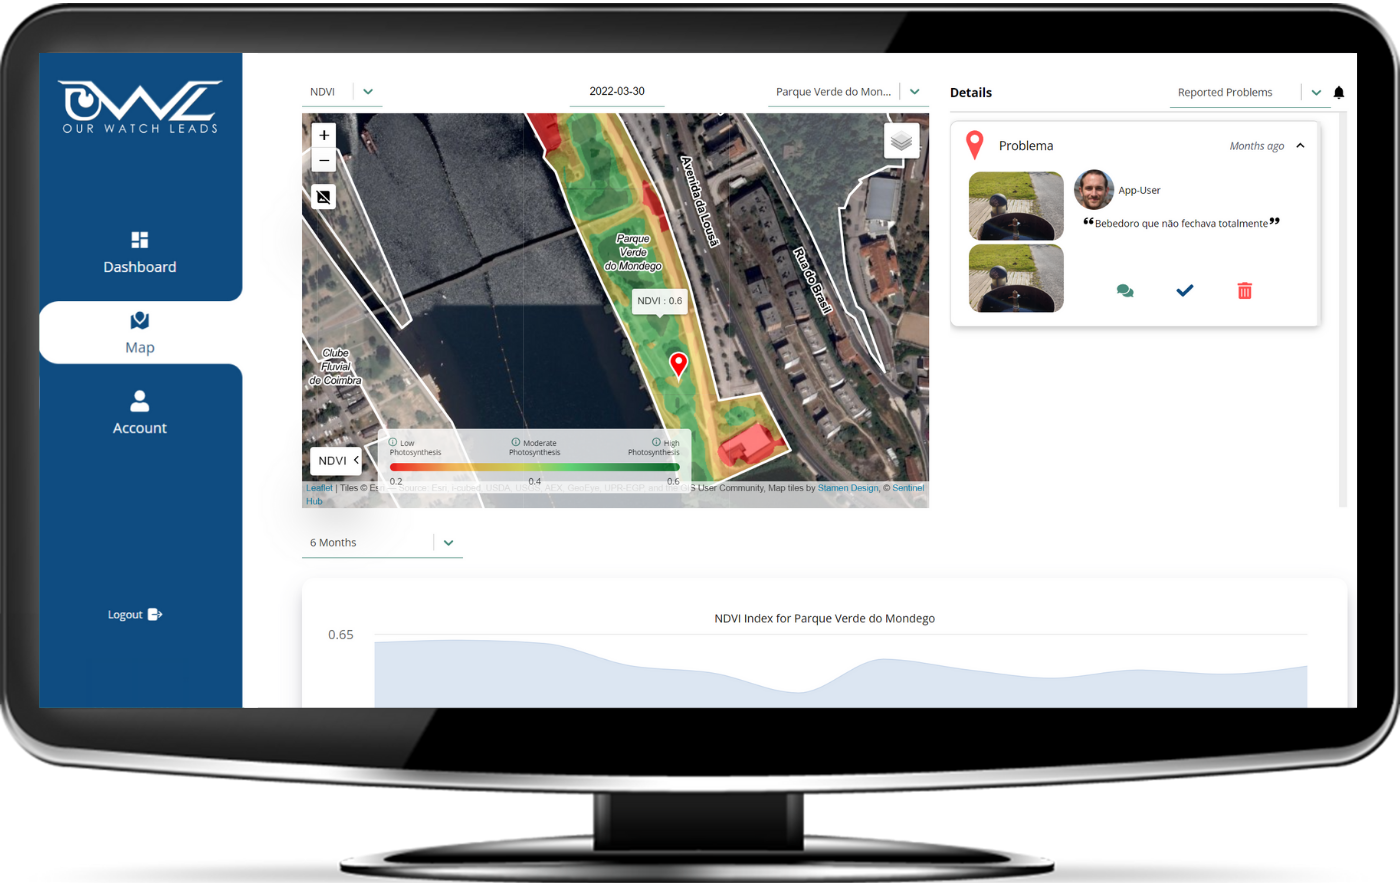
OWL Dashboard + Mobile App
Web dashboard to visualize Satellite Earth Observation indexes + Georeferenced photos and comments.
Available with 10m/pixel resolution. The dashboard includes all the satellite data/imagery from the last two years monitoring any real estate property around the world, combining the Satellite Earth Observation Indexes (LST, NDVI and NDMI) and Satellite Navigation inputs, improving results and simplifying the visualisation of several important parameters at the same time, allowing to overlay parameters or to view one at a time.
Subscription: from €270.00 + VAT/month
Simple satellite imagery
Photographic record from anywhere in the world. Available with 10m/pixel resolution. Image size adjusted to the Customer Area of Interest.
Choose from the archive or prepare for future dates, the files' sizes are optimized (tailored fit) to the user's Area of Interest size. The Simple satellite imagery includes 50 images/dates to remotely monitor the intervention site evolution.
Delivered in PNG and Geotiff (GIS Format). GIF (timelapse).
Price: from €50.00 + VAT/month

VHR satellite imagery
Very High Resolution photographic record from anywhere in the world. Available with 50cm/pixel resolution. Image size adjusted to the Customer Area of Interest.
Choose from the archive or prepare for future dates, the files' sizes are optimized (tailored fit) to the user's Area of Interest size. The VHR satellite imagery includes 10 images/dates to remotely monitor the intervention site evolution.
Delivered in PNG and Geotiff (GIS Format). GIF (timelapse).
Price: from €300.00 + VAT/month
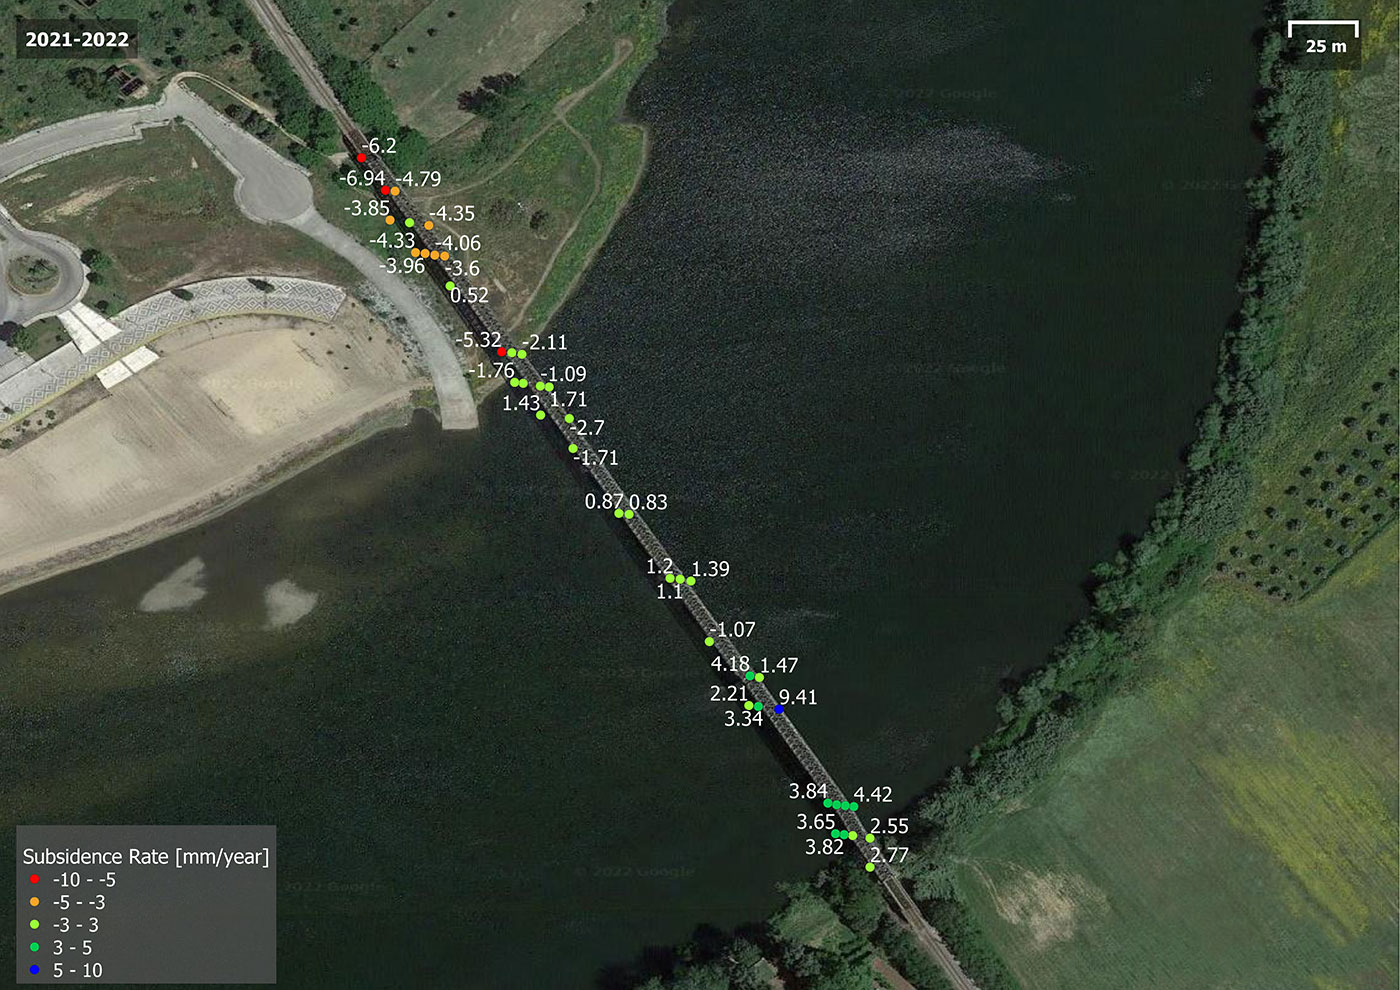
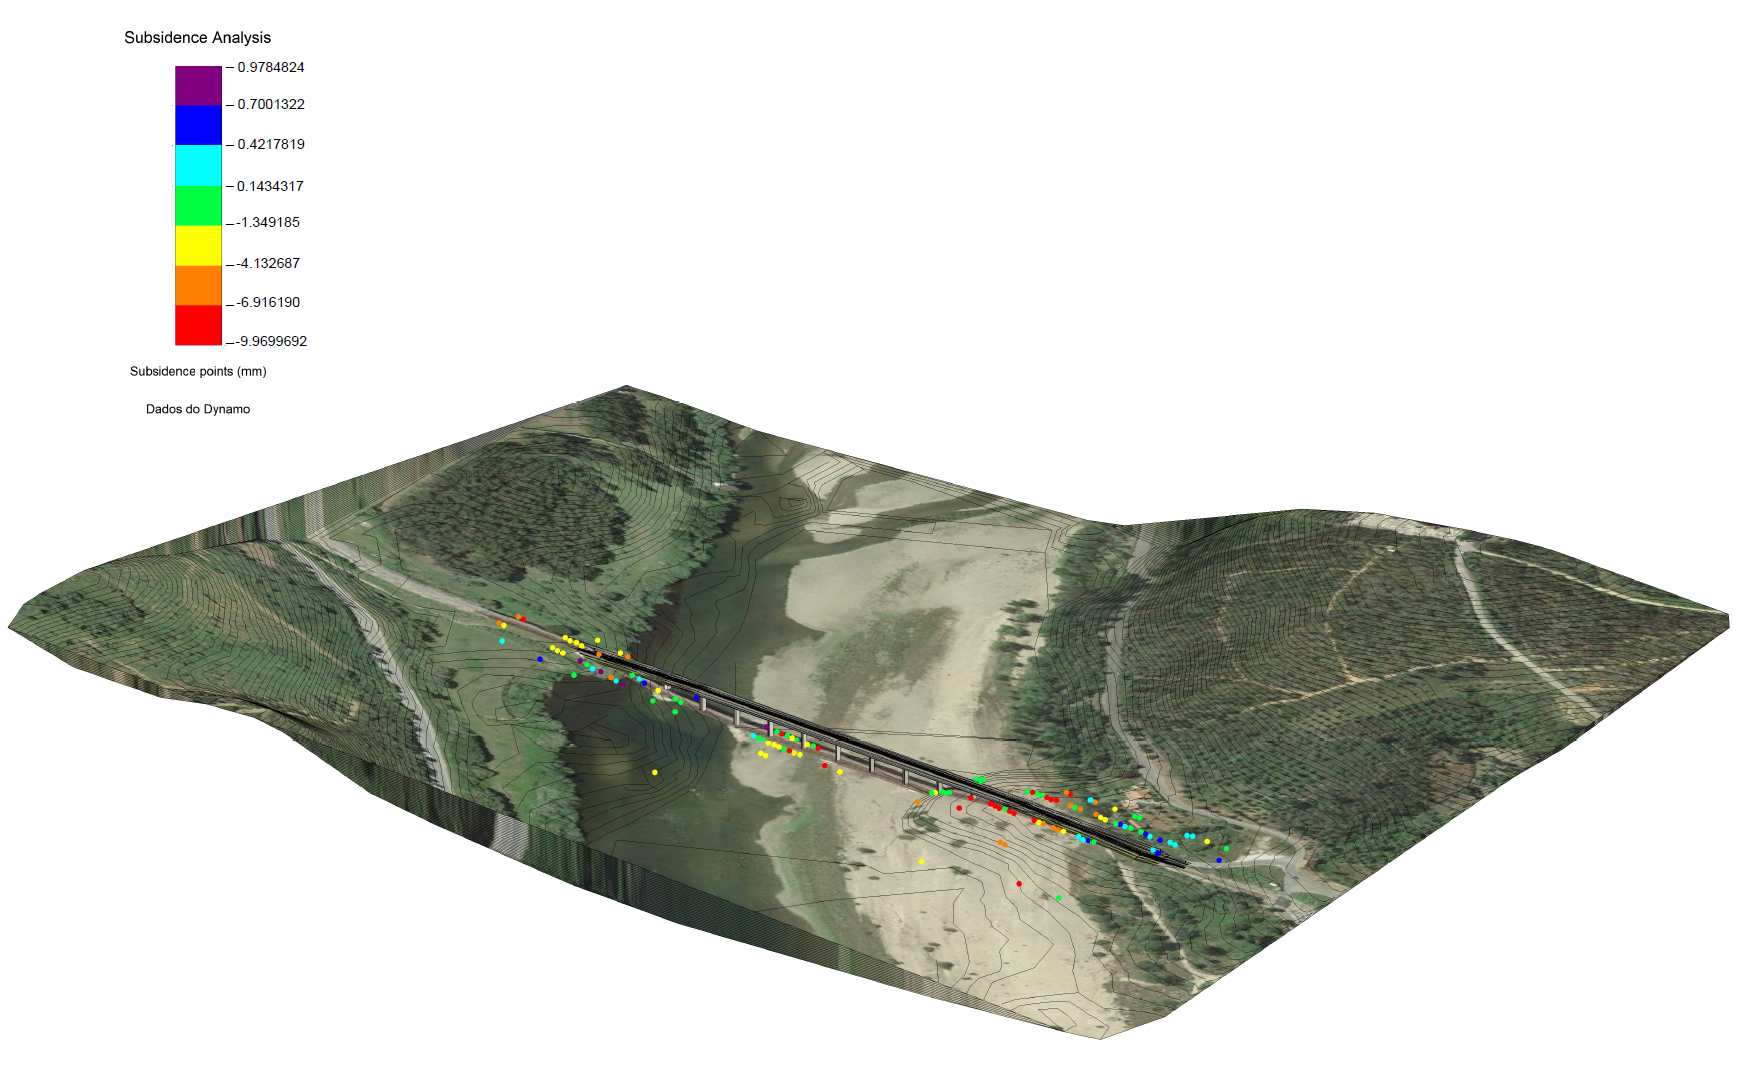
Subsidence/soil risk of collapse
One year assessment of the ground deformation in the users’ Area of Interest. Using 25-30 images from Satellite Radar data to map/monitor vertical movements of the ground, identifying the areas where the soil presents greater deformations and risk of collapse.
Available with 10m/pixel resolution. Includes a meeting to explain the methodology to the user. The subsidence analysis includes a year assessment of the vertical displacement of ground in the User’s Area of Interest.
Delivered in PNG and Geotiff (GIS Format). Can be upgraded to BIM format.
Price: from €625.00 + VAT/month
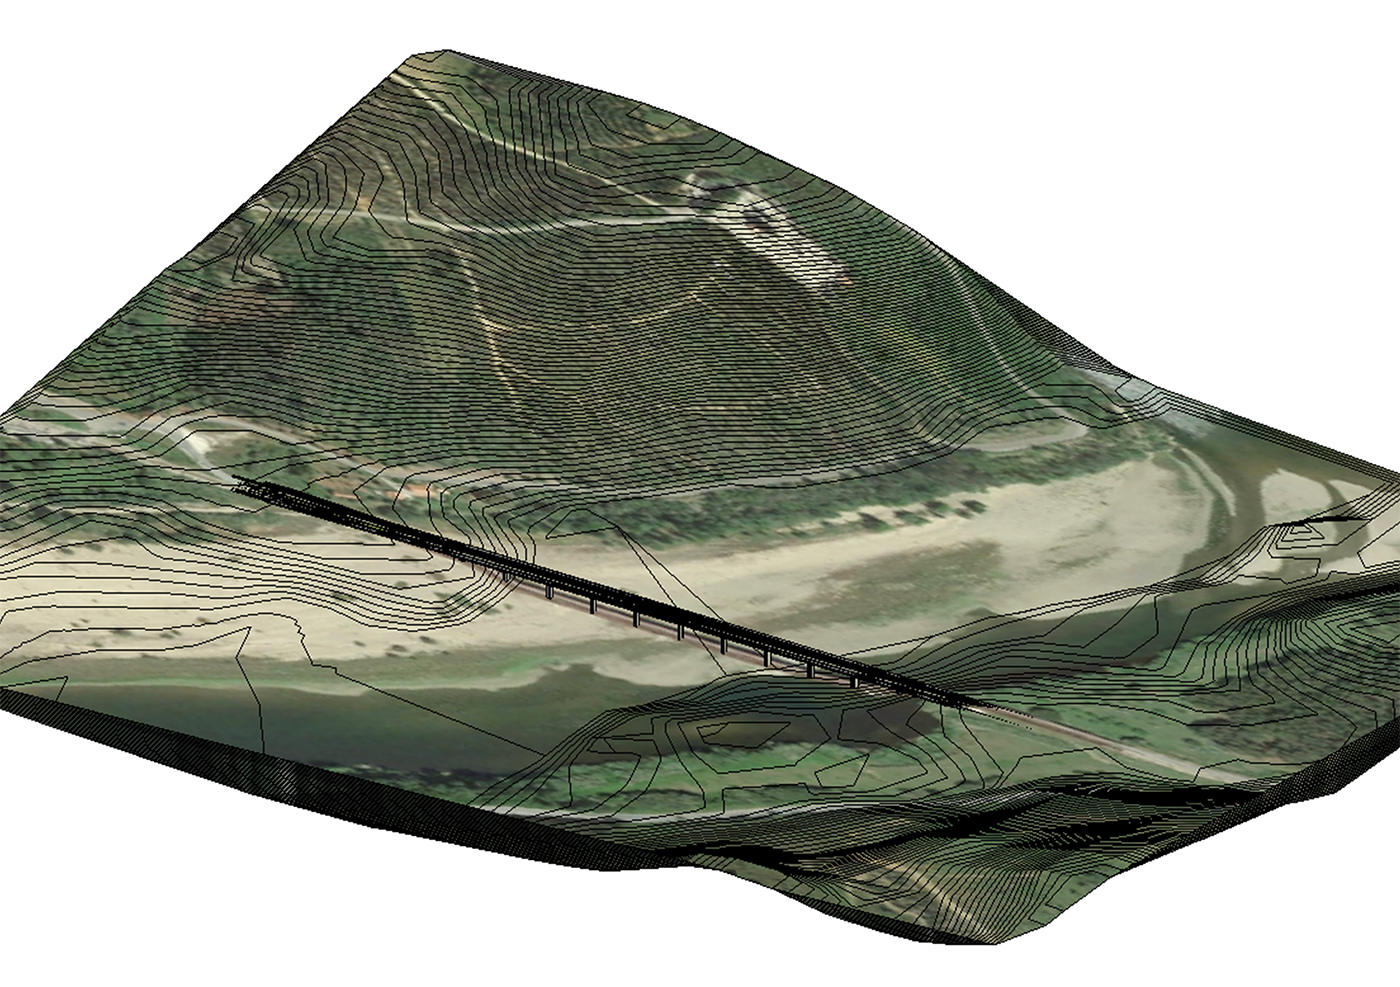
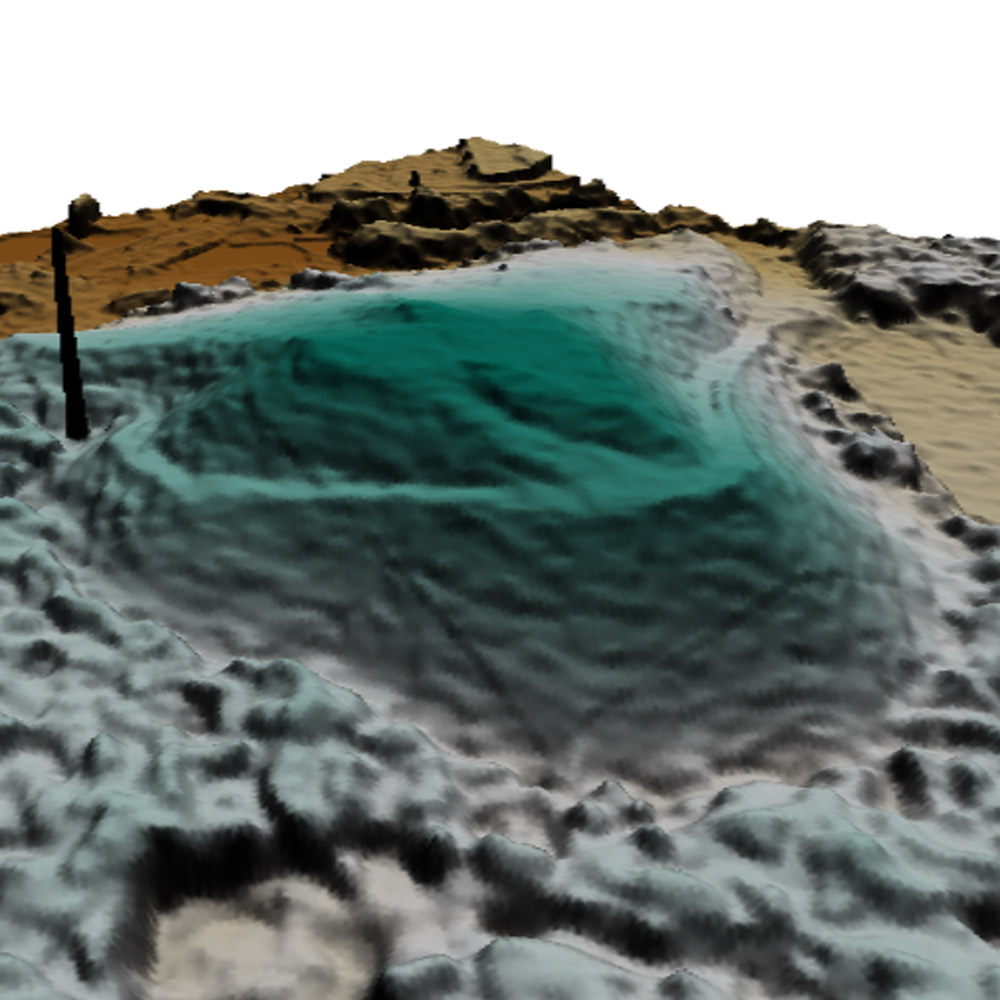
Simple topography
Topographic terrain survey using Satellite Radar Technology.
Available with 30m/pixel resolution. Topography in isolines (contours) for every 50 cm in height, and in 3D Digital Elevation Model (DEM) in the User’s Area of Interest.
Delivered in PDF and in editable formats 2D CAD, 3D BIM and Geotiff (GIS Format).
Price: from €300.00 + VAT
VHR topography in 3D BIM
Topographic terrain survey, with Very High Resolution Satellite Data.
Available with 50cm/pixel resolution. Topography in isolines (contours) for every 50 cm in height, and in 3D Digital Elevation Model (DEM).
Delivered in PDF and in editable formats 2D CAD, 3D BIM and Geotiff (GIS Format).
Price: from €11,500.00 + VAT
Topography in 3D BIM + Satellite data
Fusion of Satellite data with topographic terrain survey. This product allows to merge and quantify all of the Satellite indexes produced by OWL into a BIM 3D model of the Area of Interest.
Available with 30m/pixel and VHR with 50cm/pixel resolution. Topography in isolines (contours) for every 50 cm in height, and in 3D Digital Elevation Model (DEM).
Delivered in PDF and in editable formats 2D CAD, 3D BIM and Geotiff (GIS Format). The satellite data analysis includes a year assessment of one of OWL's parameters.
Price: from €12,750.00 + VAT
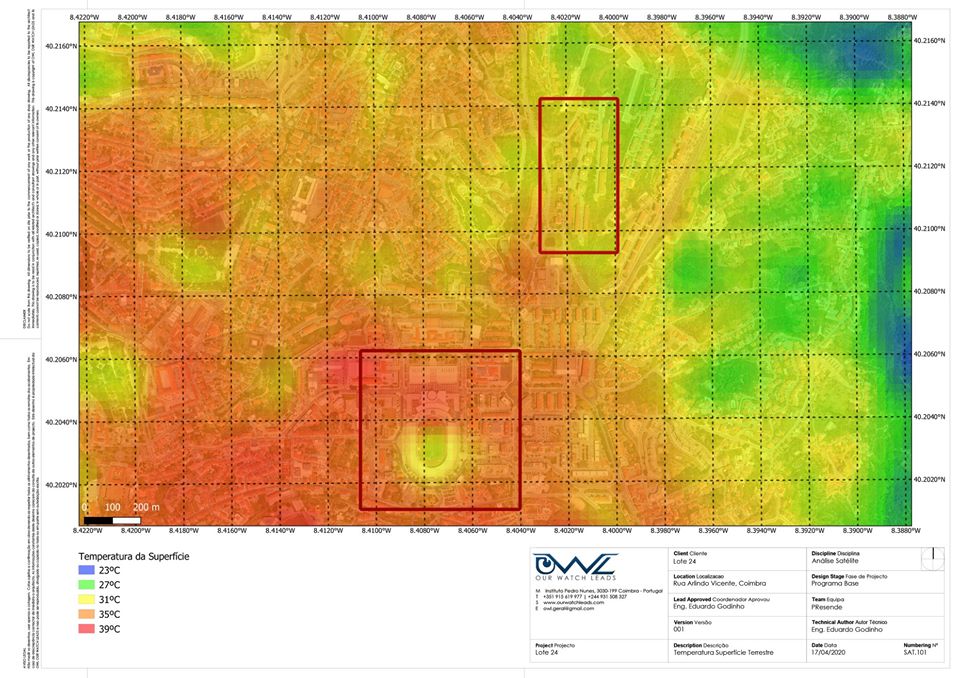
Land Surface Temperature - LST
It allows the evaluation of urban thermal comfort, perceiving the exchange of water between soil and atmosphere, areas of excess heat or cold, areas of possible fire occurrence. Also useful to map variations in ºC of a given agricultural property, for cultures such as wineries in which the quality of the final product is highly dependent on this factor.
Available with 30m/pixel resolution. The Land Surface Temperature – LST includes a year assessment of the temperatures in the User’s Area of Interest.
Delivered in PDF and Geotiff (GIS Format).
Price: from €35.00 + VAT/month
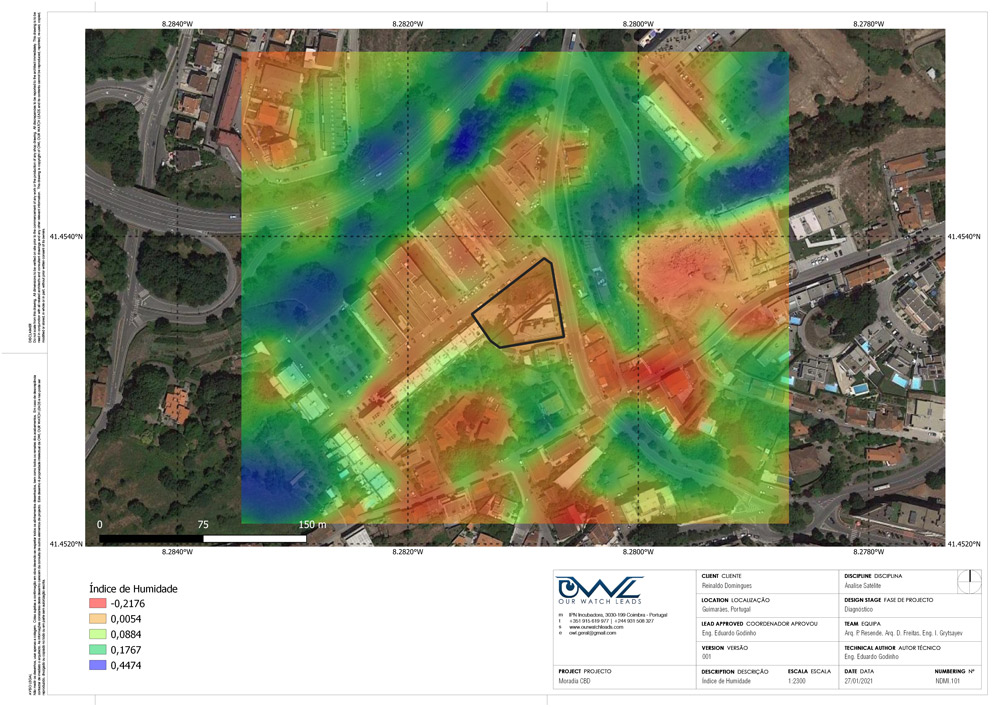
Vegetation Water - NDMI
Vegetation water content. The Normalized difference moisture index allows to measure differences in the water content of leaves. Distinguishes vegetation in water stress from the areas where there is vegetation with good levels of water availability. Ideal product for planning and managing of green spaces.
Available with 10m/pixel resolution. The Vegetation Water - NDMI includes a year assessment of the surface and vegetation water/moisture in the User’s Area of Interest.
Delivered in PDF and Geotiff (GIS Format).
Price: from €35.00 + VAT/month
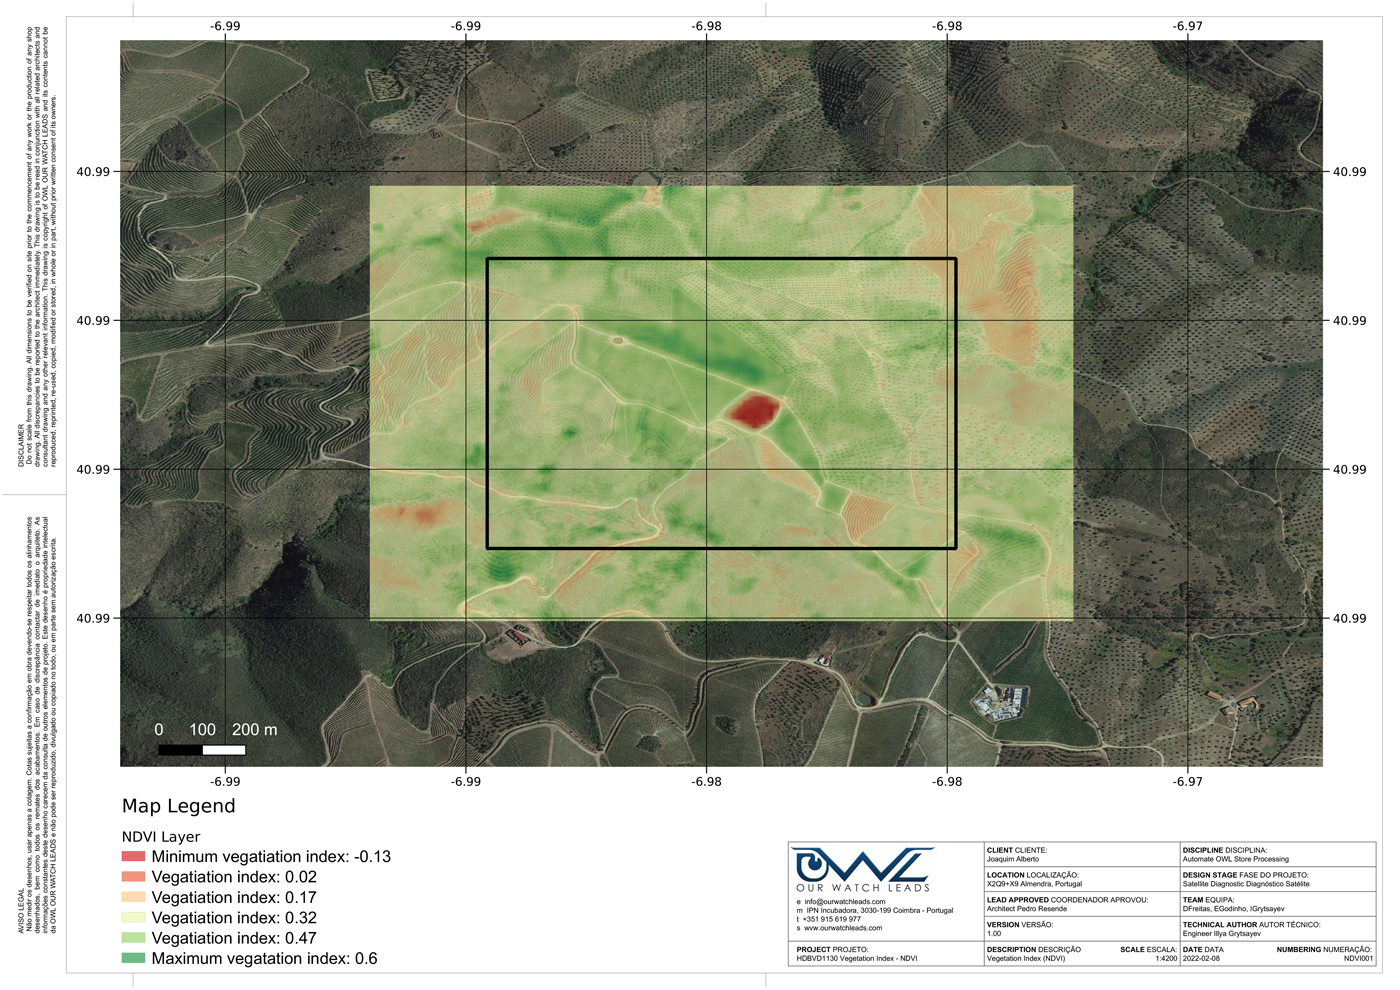
Vegetation Index - NDVI
Vegetation health and density. The Normalised Difference Vegetation Index (NDVI) allows differentiating dense and healthy vegetation from more scattered vegetation, fallen leaves, dead plants and artificial ground. A high NDVI is directly related to the photosynthetic capacity and, consequently, to the energy absorption of the plant canopy.
Available with 10m/pixel resolution. The Vegetation Index – NDVI includes a year assessment of the location and health of plants in the User’s Area of Interest.
Delivered in PDF and Geotiff (GIS Format).
Price: from €35.00 + VAT/month
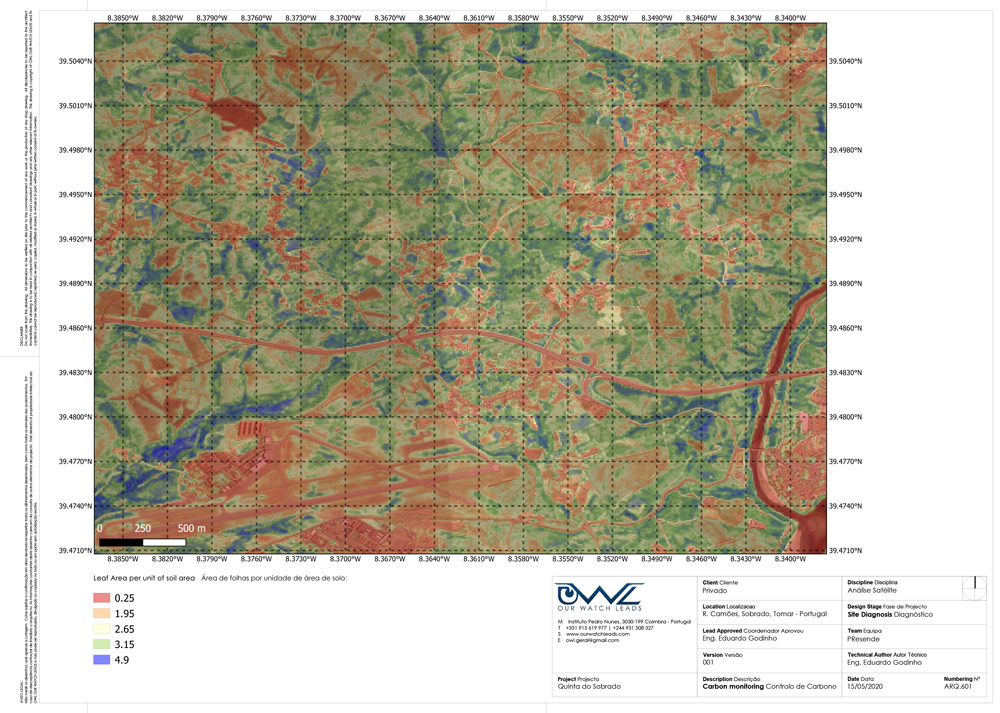
Biomass Index - LAI
The amount of biomass in leaves determines the Leaf Area Index – LAI. The index is a measure for the total area of leaves per unit ground area and directly related to the amount of light that can be intercepted by plants. It is an important variable used to predict photosynthetic primary production, evapotranspiration and as a reference tool for crop growth.
Available with 10m/pixel resolution. The Biomass Index – LAI includes a year assessment of the location and health of plants in the User’s Area of Interest.
Delivered in PDF and Geotiff (GIS Format).
Price: from €35.00 + VAT/month
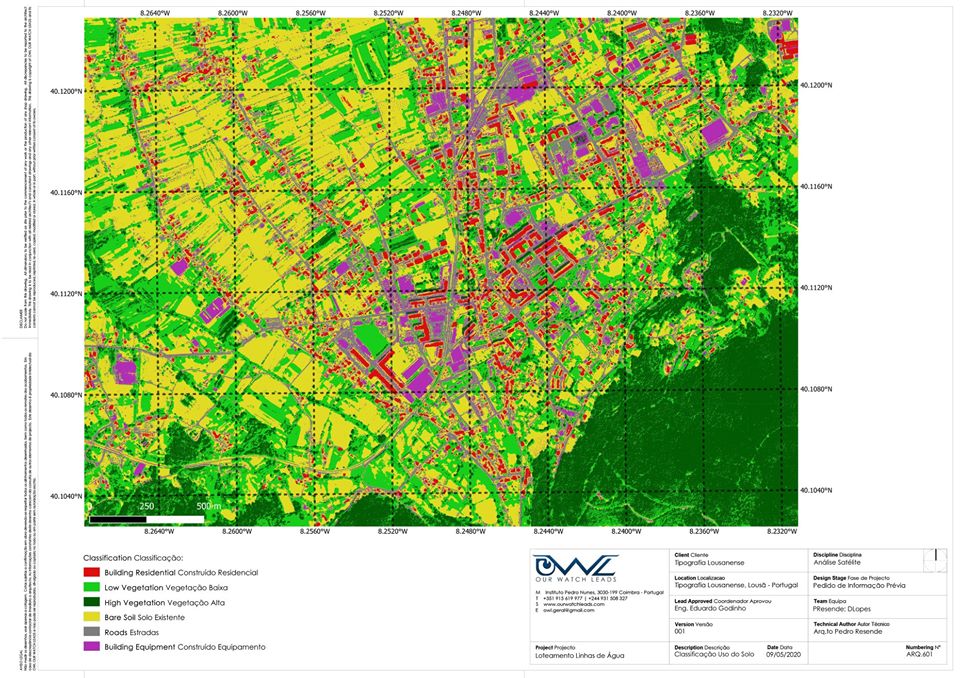
Soil use classification
Soil use classification mapping using machine learning and deep learning techniques. Differentiating residential buildings from commercial/industrial buildings, roads from bare soil with no vegetation, high vegetation from low vegetation. Ideal product to update territory mapping and GIS information.
Available with 50cm/pixel resolution. The Soil use classification includes the past or present mapping of the territory. It can also include predictivity layer, estimating urban growth in future dates in the User’s Area of Interest.
Delivered in PDF and Geotiff (GIS Format).
Price: from €1,200.00 + VAT/month
Air quality - regional level
Ideal product to monitor ozone, methane, formaldehyde, aerosol, carbon monoxide, nitrogen dioxide (NO2) and sulfur dioxide (SO2) in the atmosphere of regional territories and cities.
Available with 7km/pixel resolution. The Air quality - regional level includes a year assessment, distinguishing what are the best and worst regions/cities in terms of air quality in the User’s Area of Interest.
Delivered in JPEG and GIF.
Price: from €75.00 + VAT/month
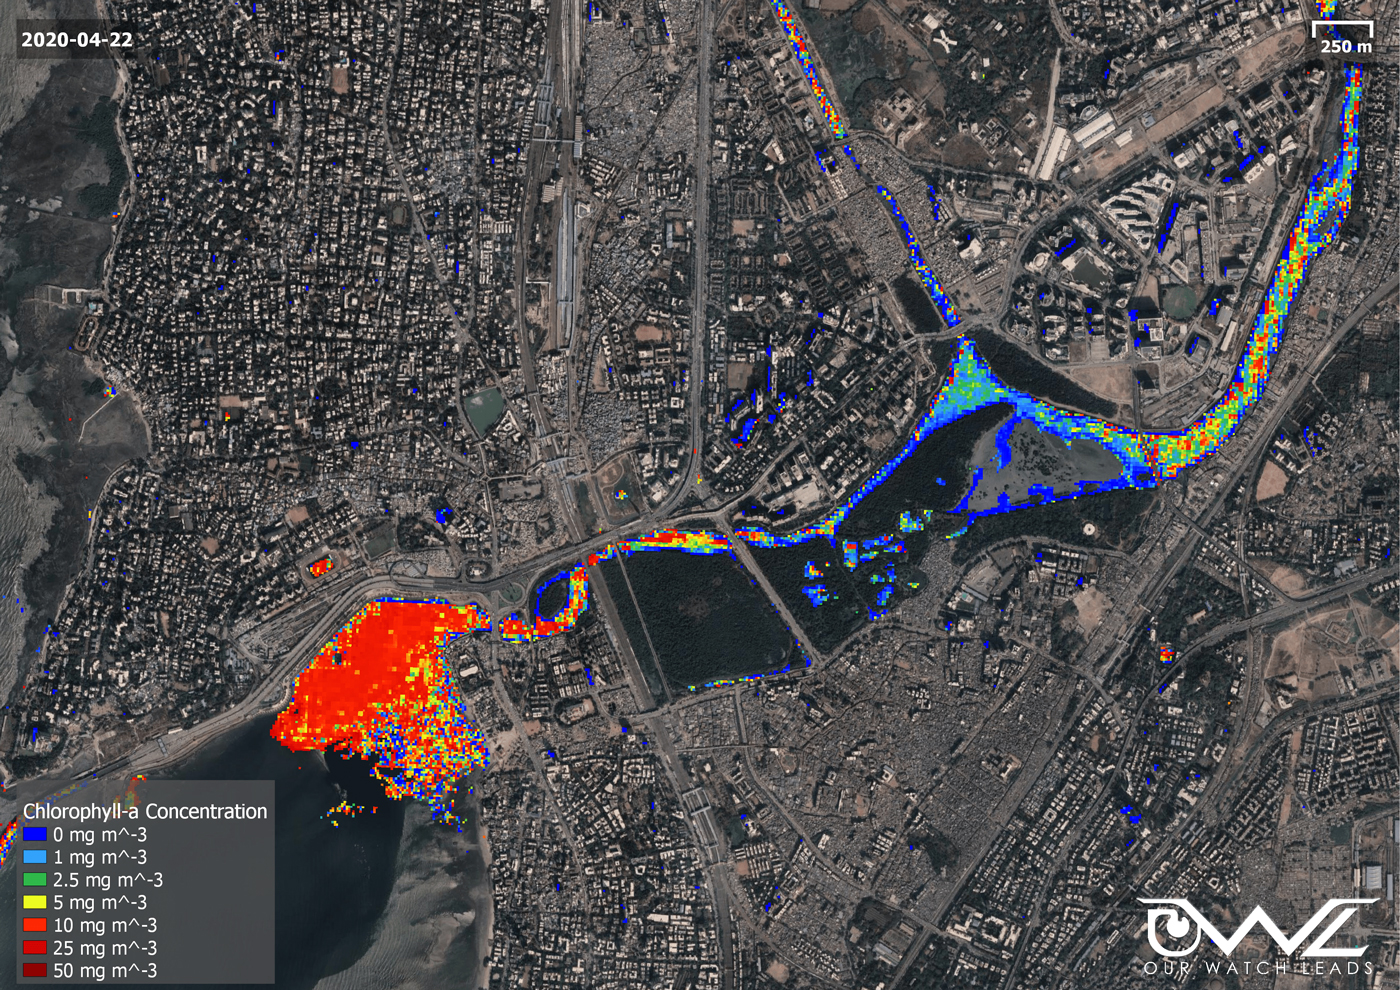
Water quality
The water quality assessment provides six relevant indicators of water quality: (i) the concentration of Chlorophyll a (Chl_a), (ii) the density of cyanobacteria (Cya), (iii) turbidity (turb), (iv) colored dissolved organic matter (CDOM), (v) dissolved organic carbon (DOC), and (vi) water color (Color). These indicators are used to define the trophic state on inland waters, which is particularly important when these waters are used for human consumption or leisure activities, for agriculture or industrial purposes and for the sustainibility of the biodiversity in the Areas of Interest.
Available with 10m/pixel resolution. The Water quality includes a year assessment, distinguishing what are the best and worst areas in terms of water quality in the User’s Area of Interest.
Price: from €125.00 + VAT/month

Fire risk/monitoring
One year assessment of the fire risk lands/properties in the users' Area of Interest. Using satellite data to monitor the risk or the impact of wild fires.
Available with 10m/pixel resolution. The Fire risk/monitoring includes a year assessment, distinguishing what are the best and worst areas in terms of risk of occurring wild fires or the post wild fire assessment.
Delivered in PNG and Geotiff (GIS Format). Can be upgraded to BIM format.
Price: from €125.00 + VAT/month
Flood risk/monitoring
One year assessment of the flood risk lands/properties in the users' Area of Interest. Using multi-temporal Satellite Radar data to map rivers, floods and waterways.
Available with 10m/pixel resolution. The Flood risk includes a year assessment, distinguishing what are the best and worst areas in terms of risk of flooding or the post flood assessment.
Delivered in PNG and Geotiff (GIS Format). Can be upgraded to BIM format.
Price: from €125.00 + VAT/month
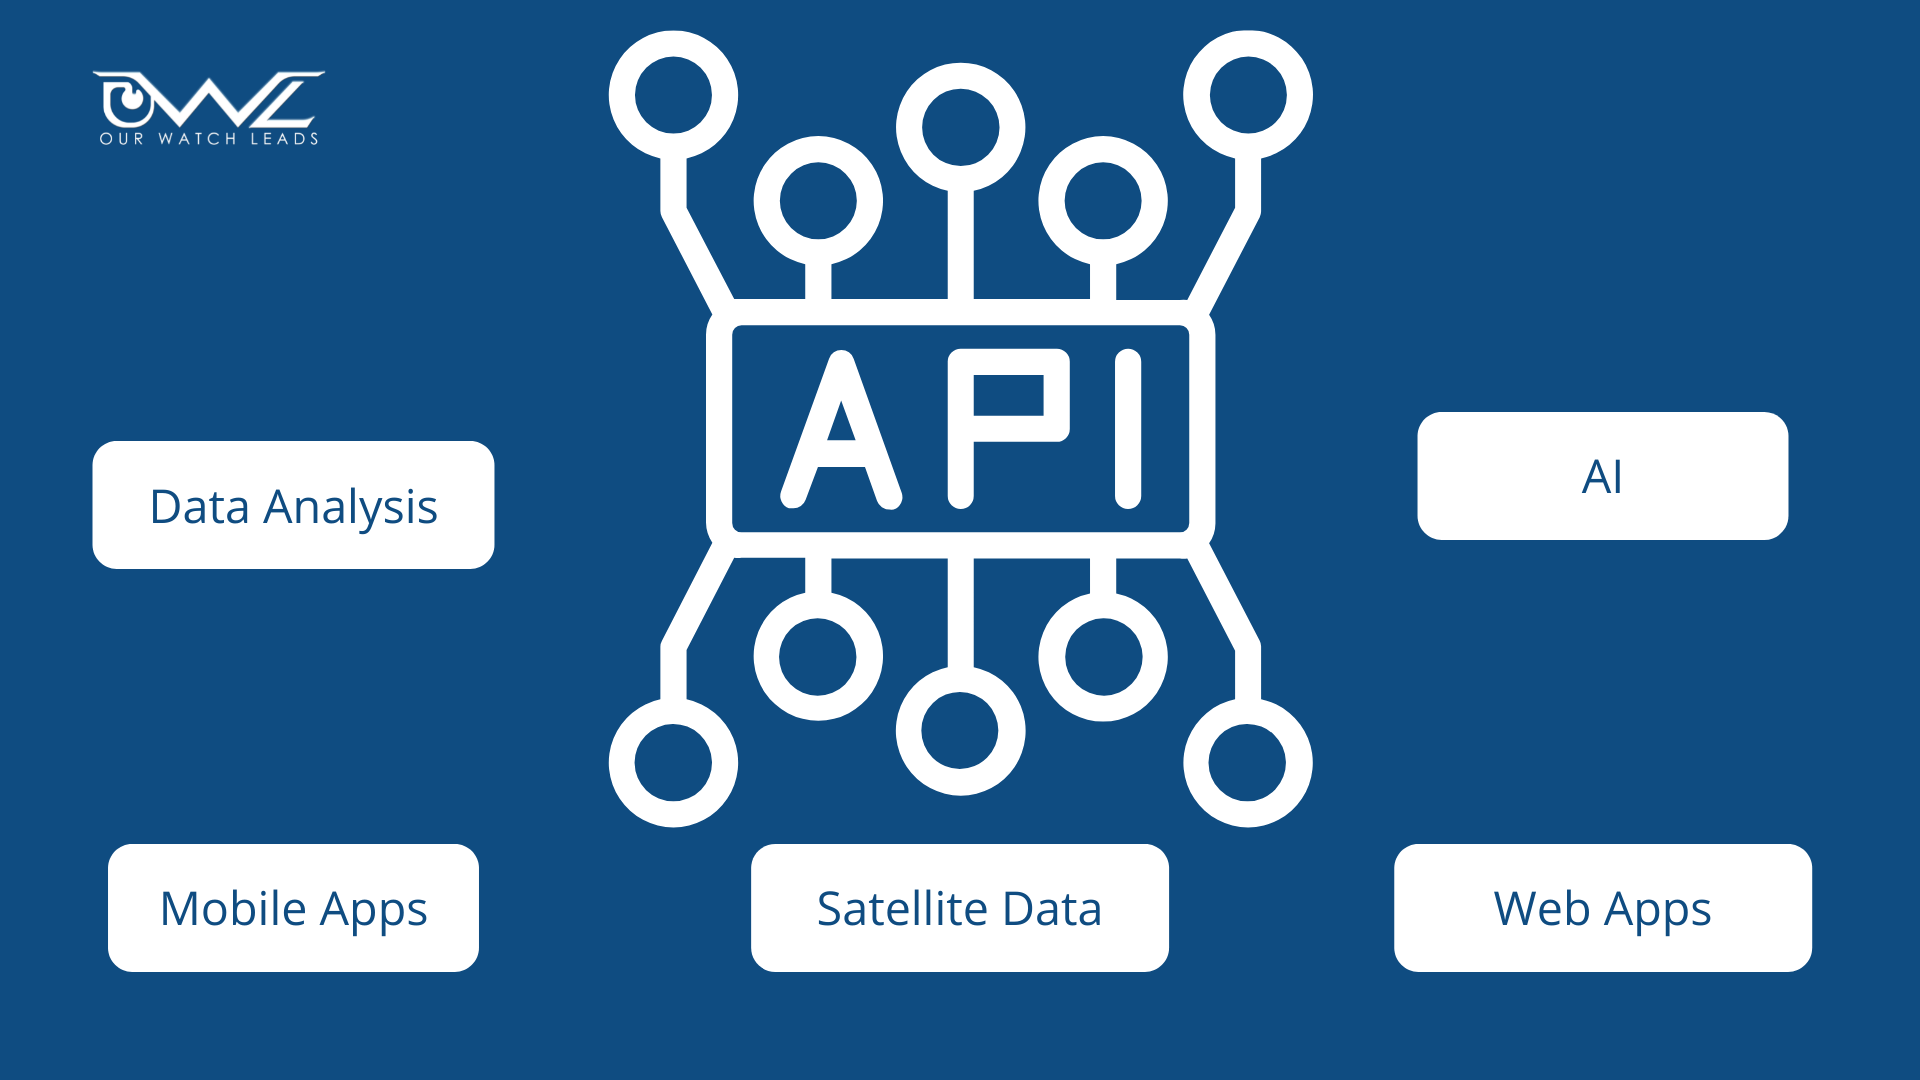
API
With the Application Programming Interface (API) service, OWL customers can process and integrate their satellite data into their own applications. The API allows easy integration of satellite data into processing scripts (jupyter notebooks, for example) as well as processing large amounts of raw satellite data, image rendering, statistical analysis, creation of AI models, all possibilities that make it easy to analyze any intervention site at any time period.

OWL consulting
The consultation time allows the user to understand how to use the OWL store and the additional value of each product. The objective of this hour will be to detail an ideal route for the user, with validation of the products to purchase, tailored to the customer's preferences.